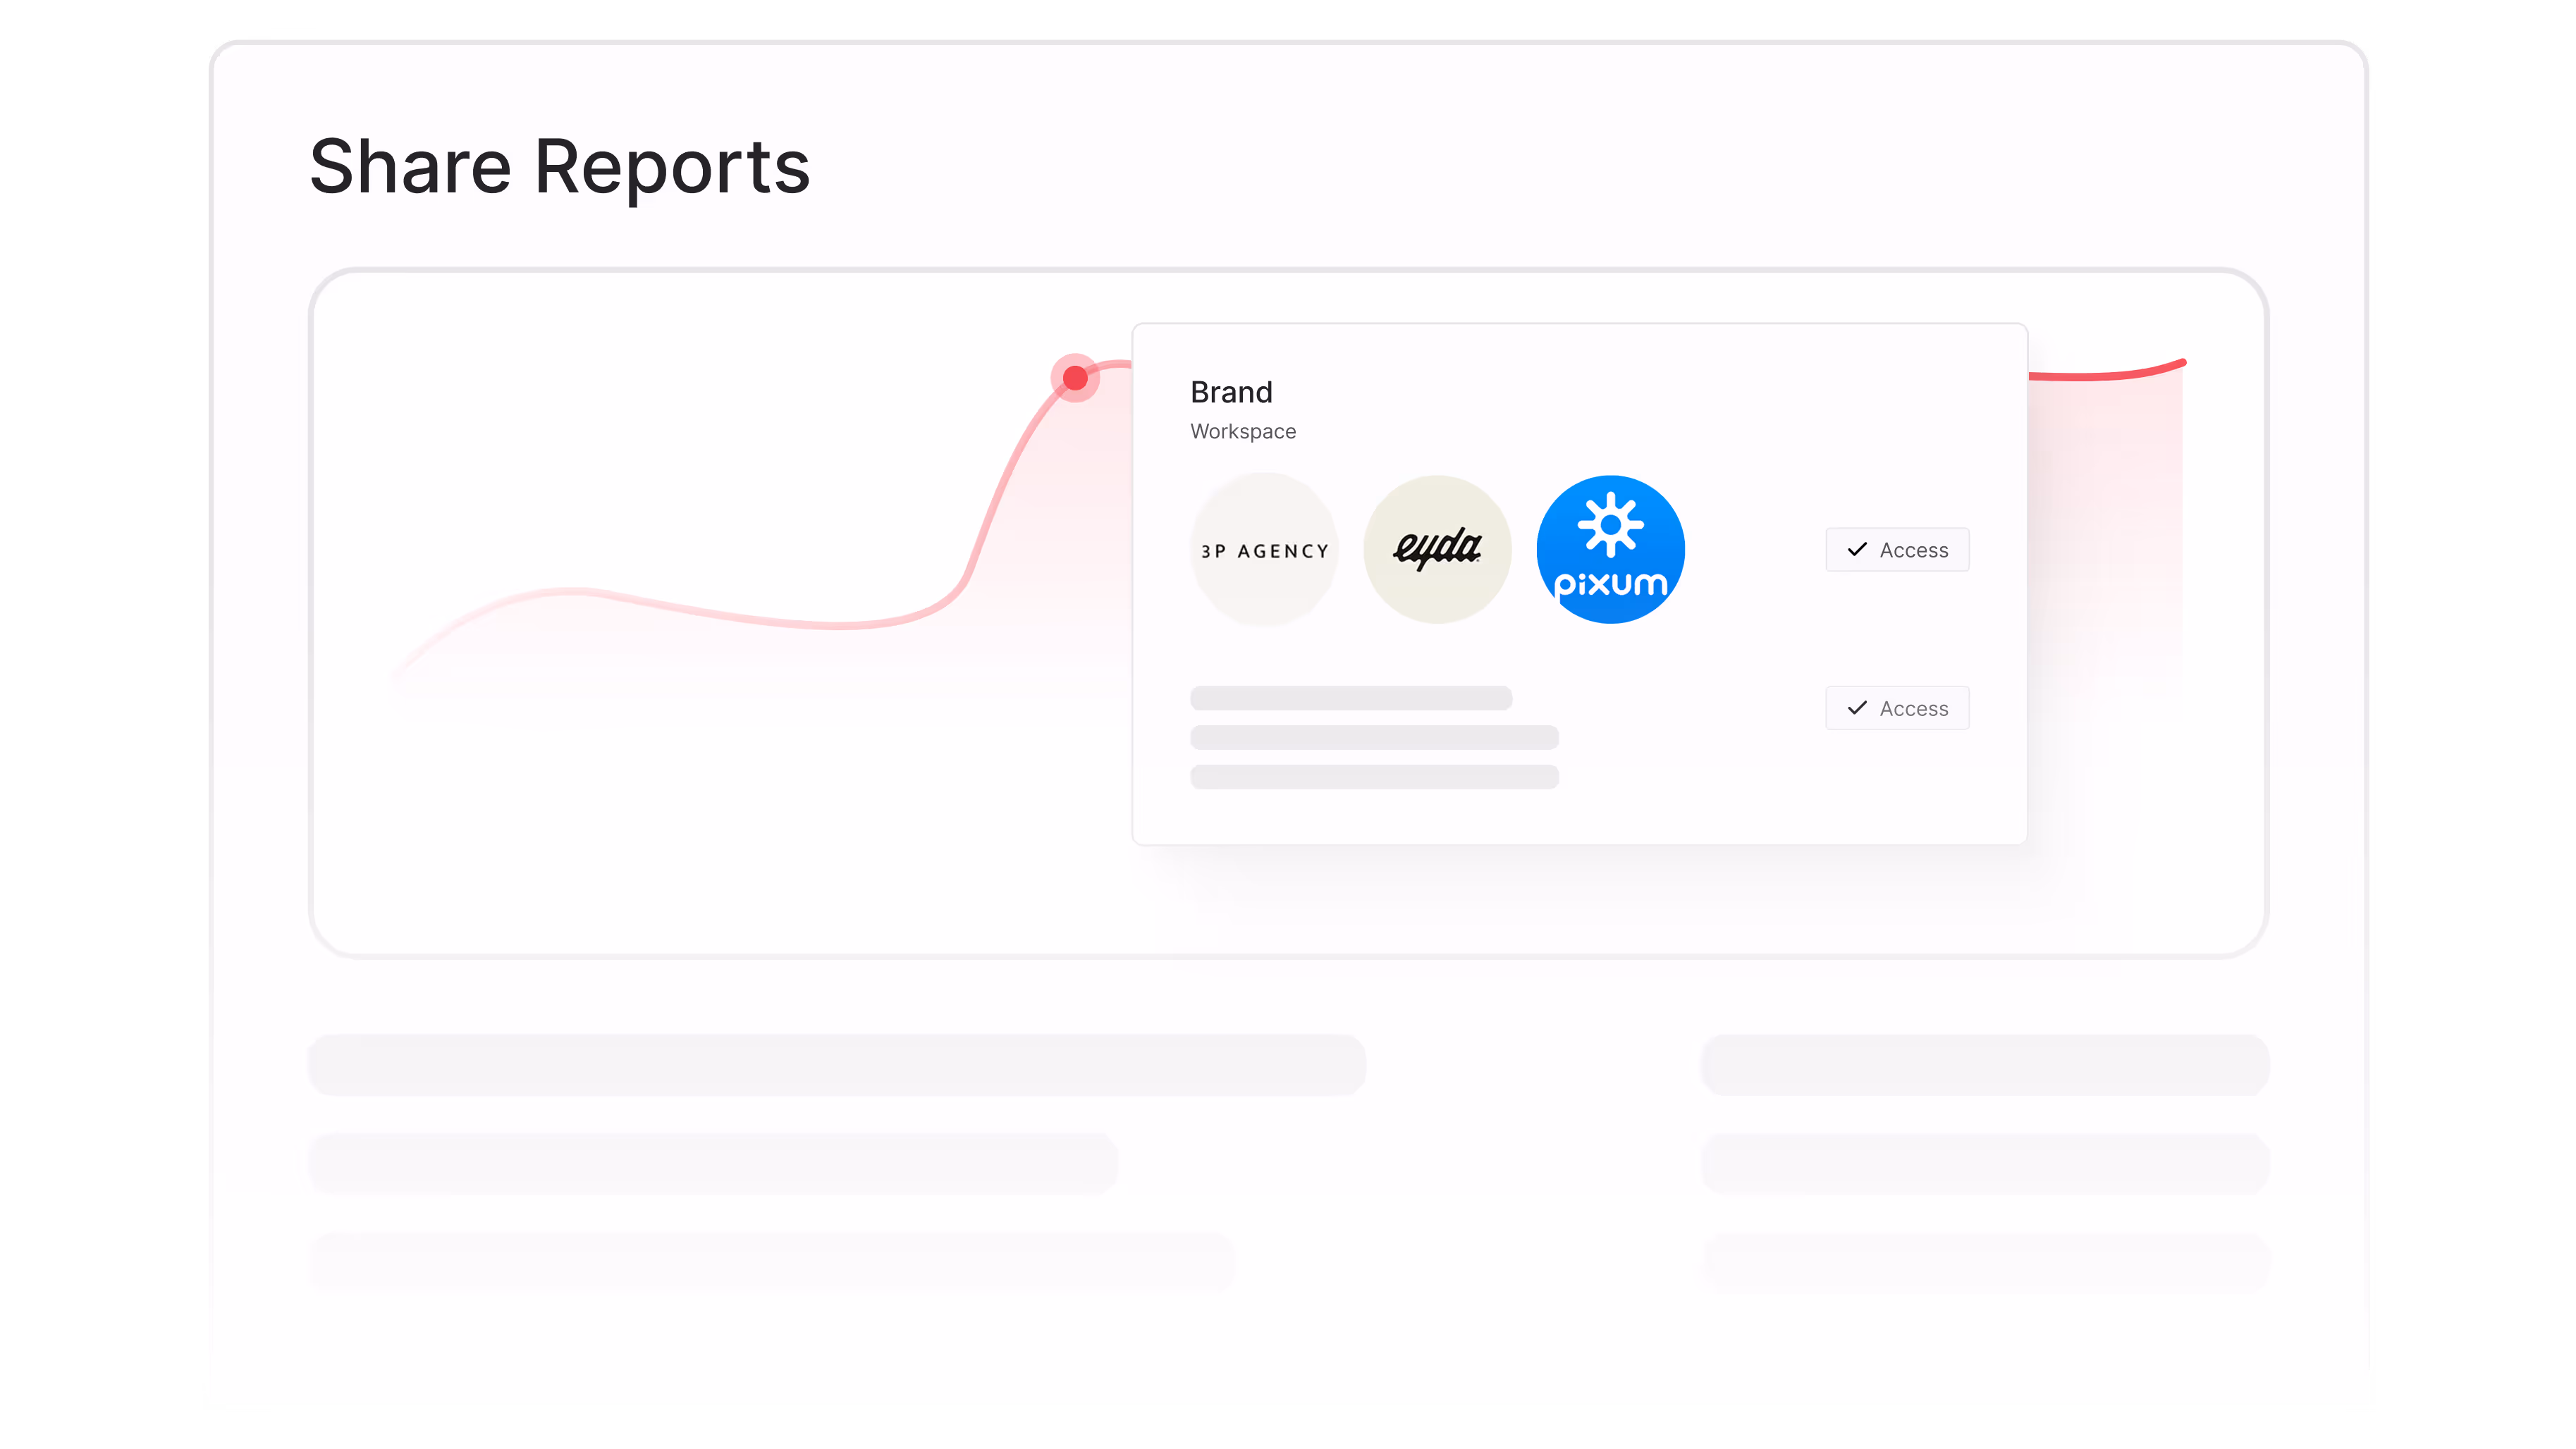
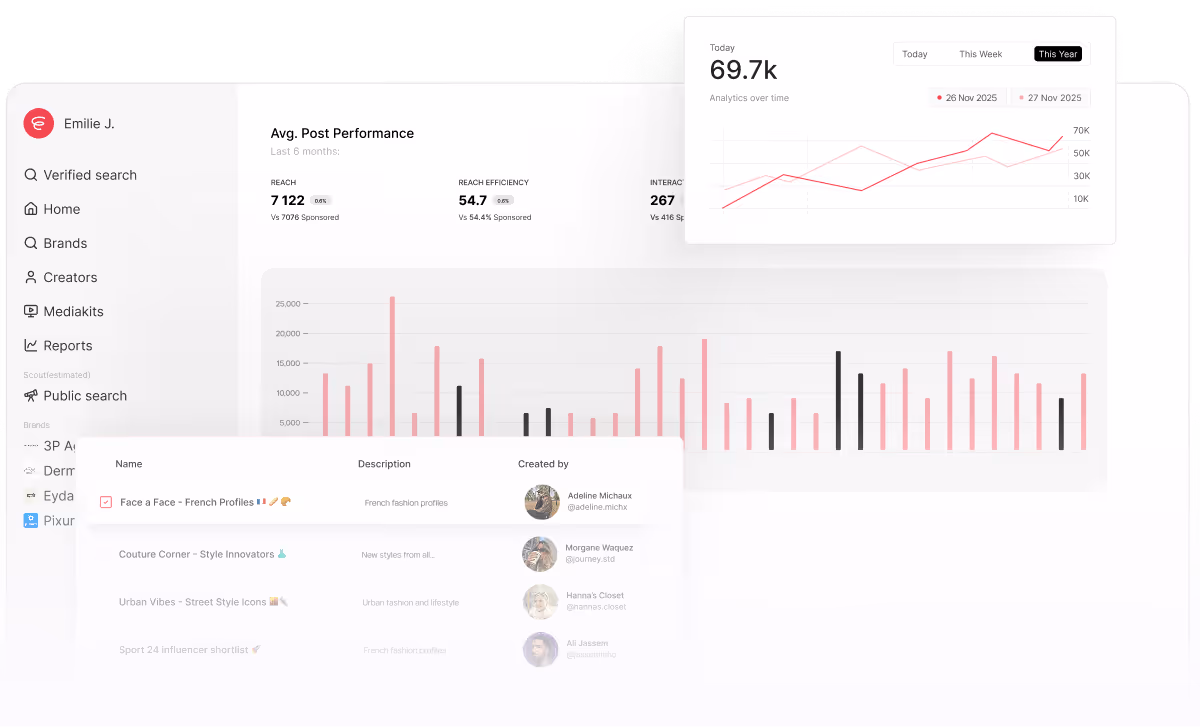
See performance while it’s happening
Stop screenshotting posts and stitching reports together. Share a live dashboard link instead — always current, always client-ready.


One dashboard for everything that matters
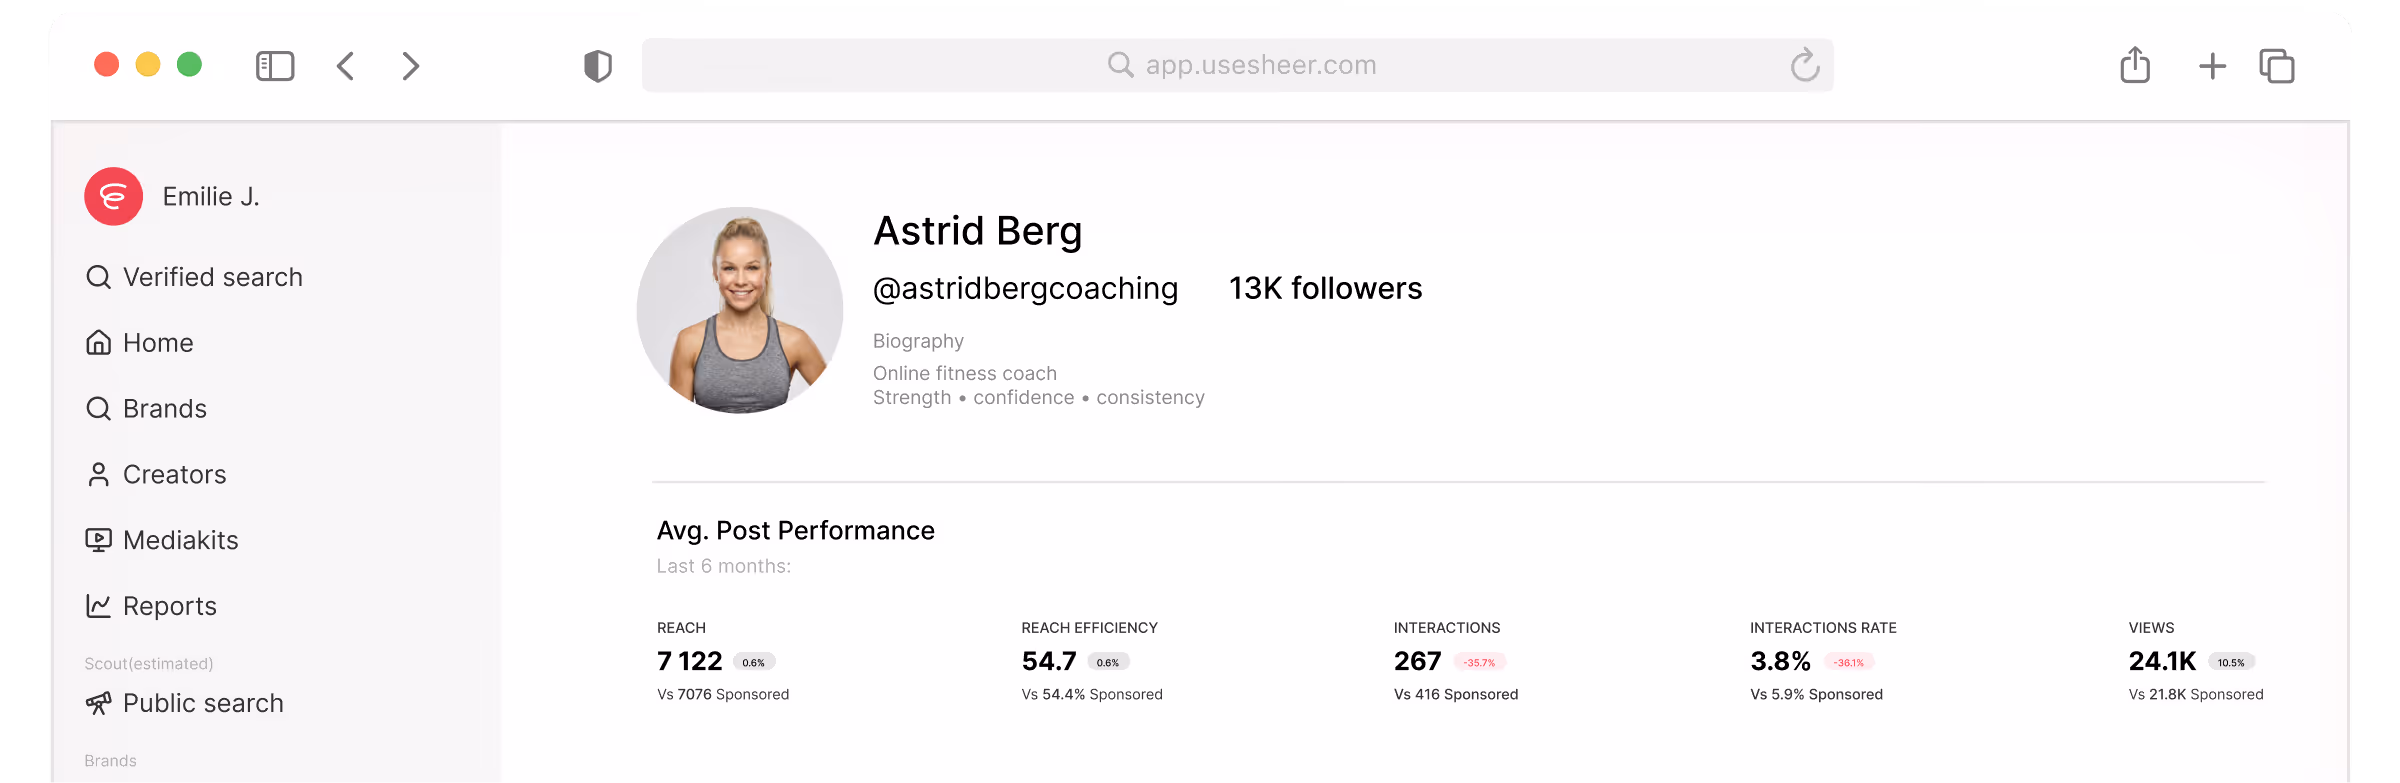
See which creators are actually driving results — verified with first-party data. Double down on what's working and cut what isn't.
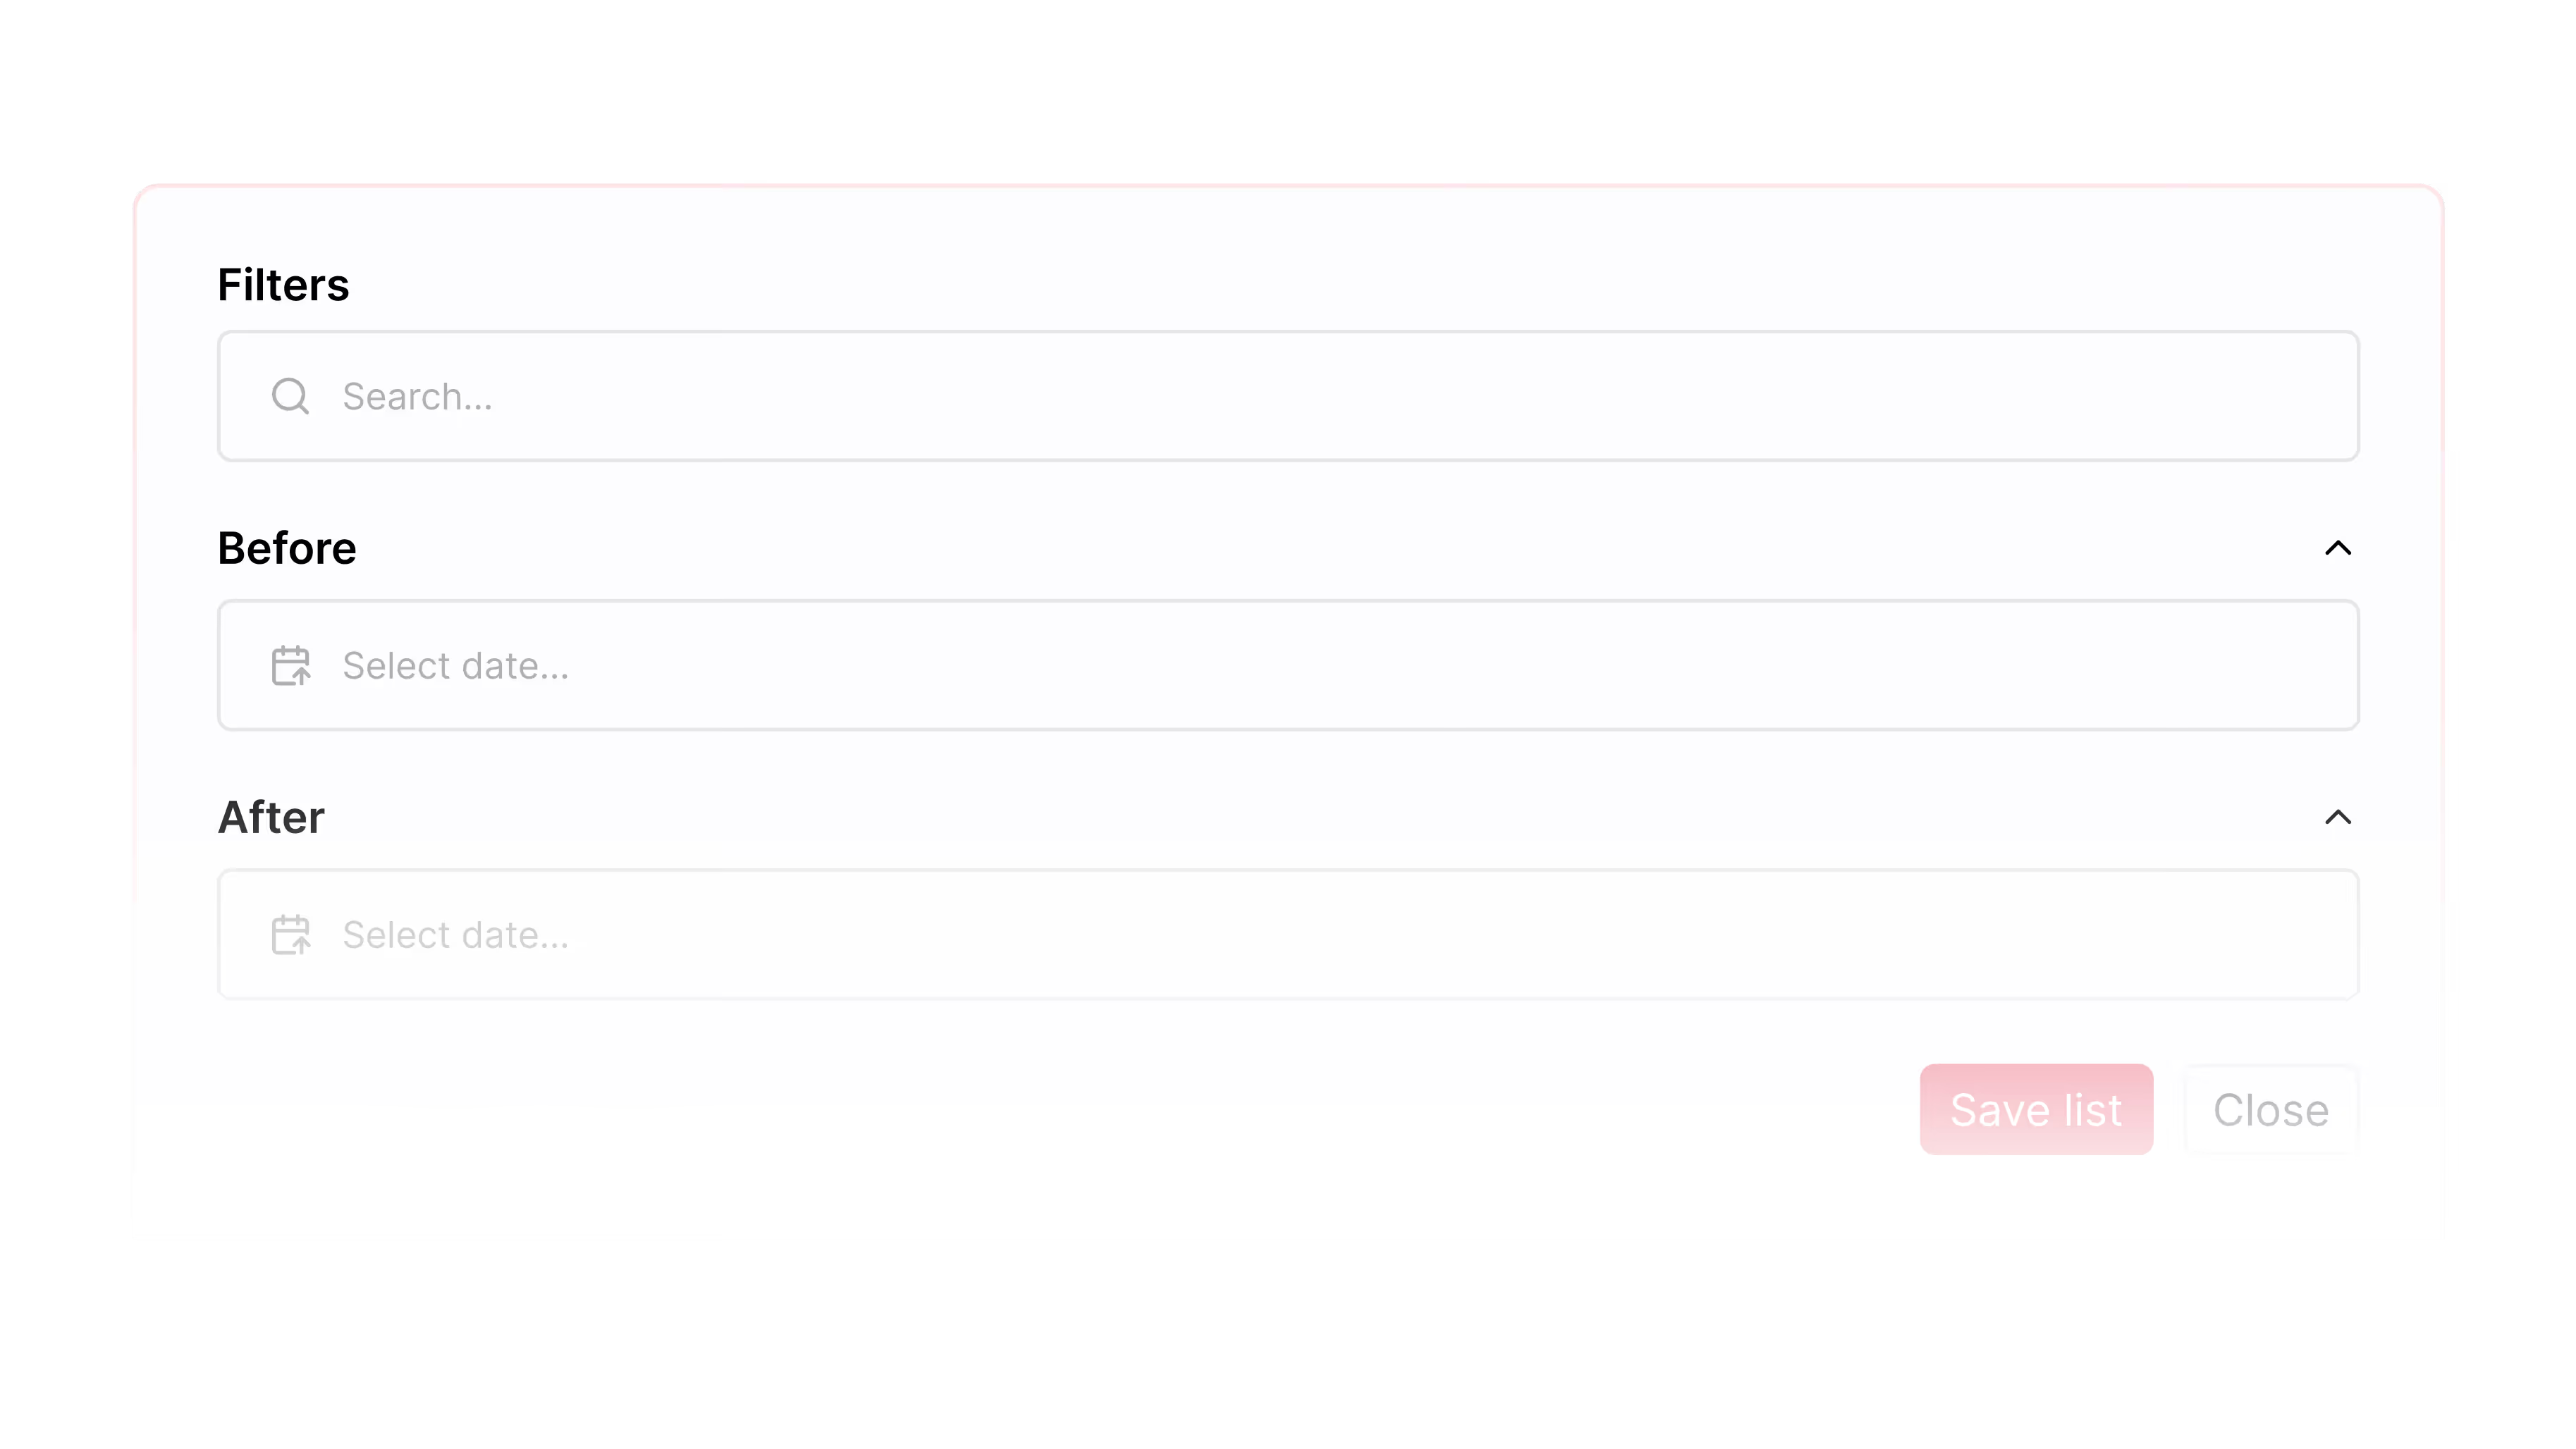
Track the KPIs that matter to you
Filter reports by the metrics your clients actually care about. No noise, just the numbers you need to show results.
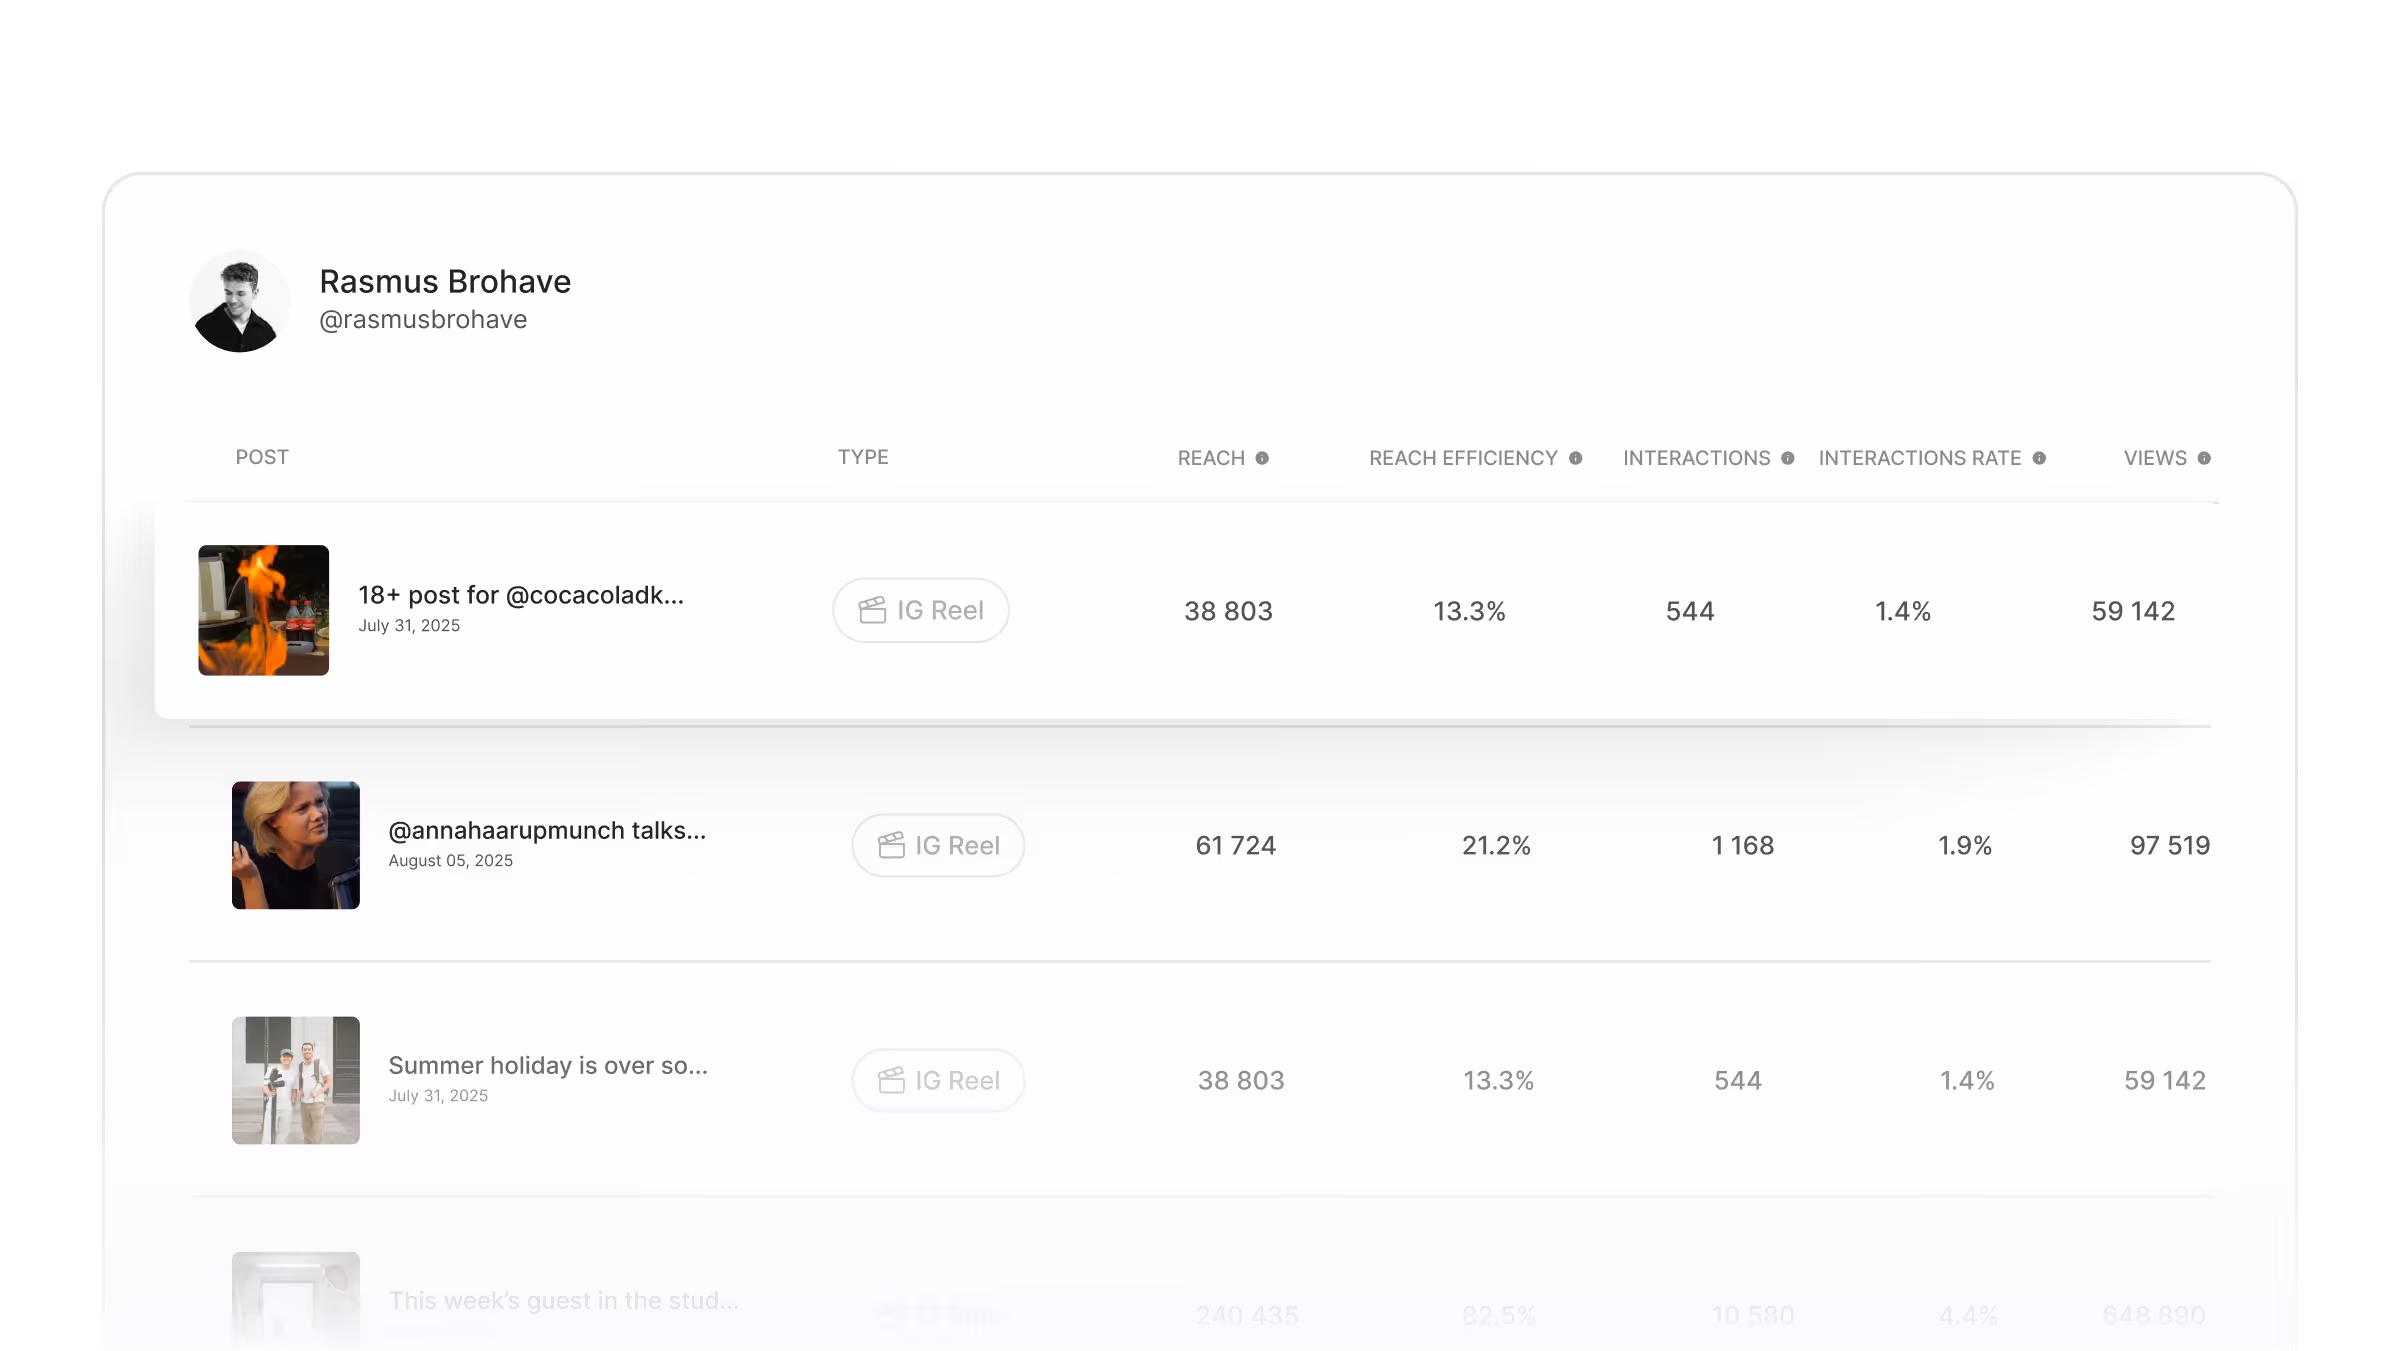
See exactly who's performing
Go beyond vanity metrics. See per-creator performance data so you know who's driving results and why.
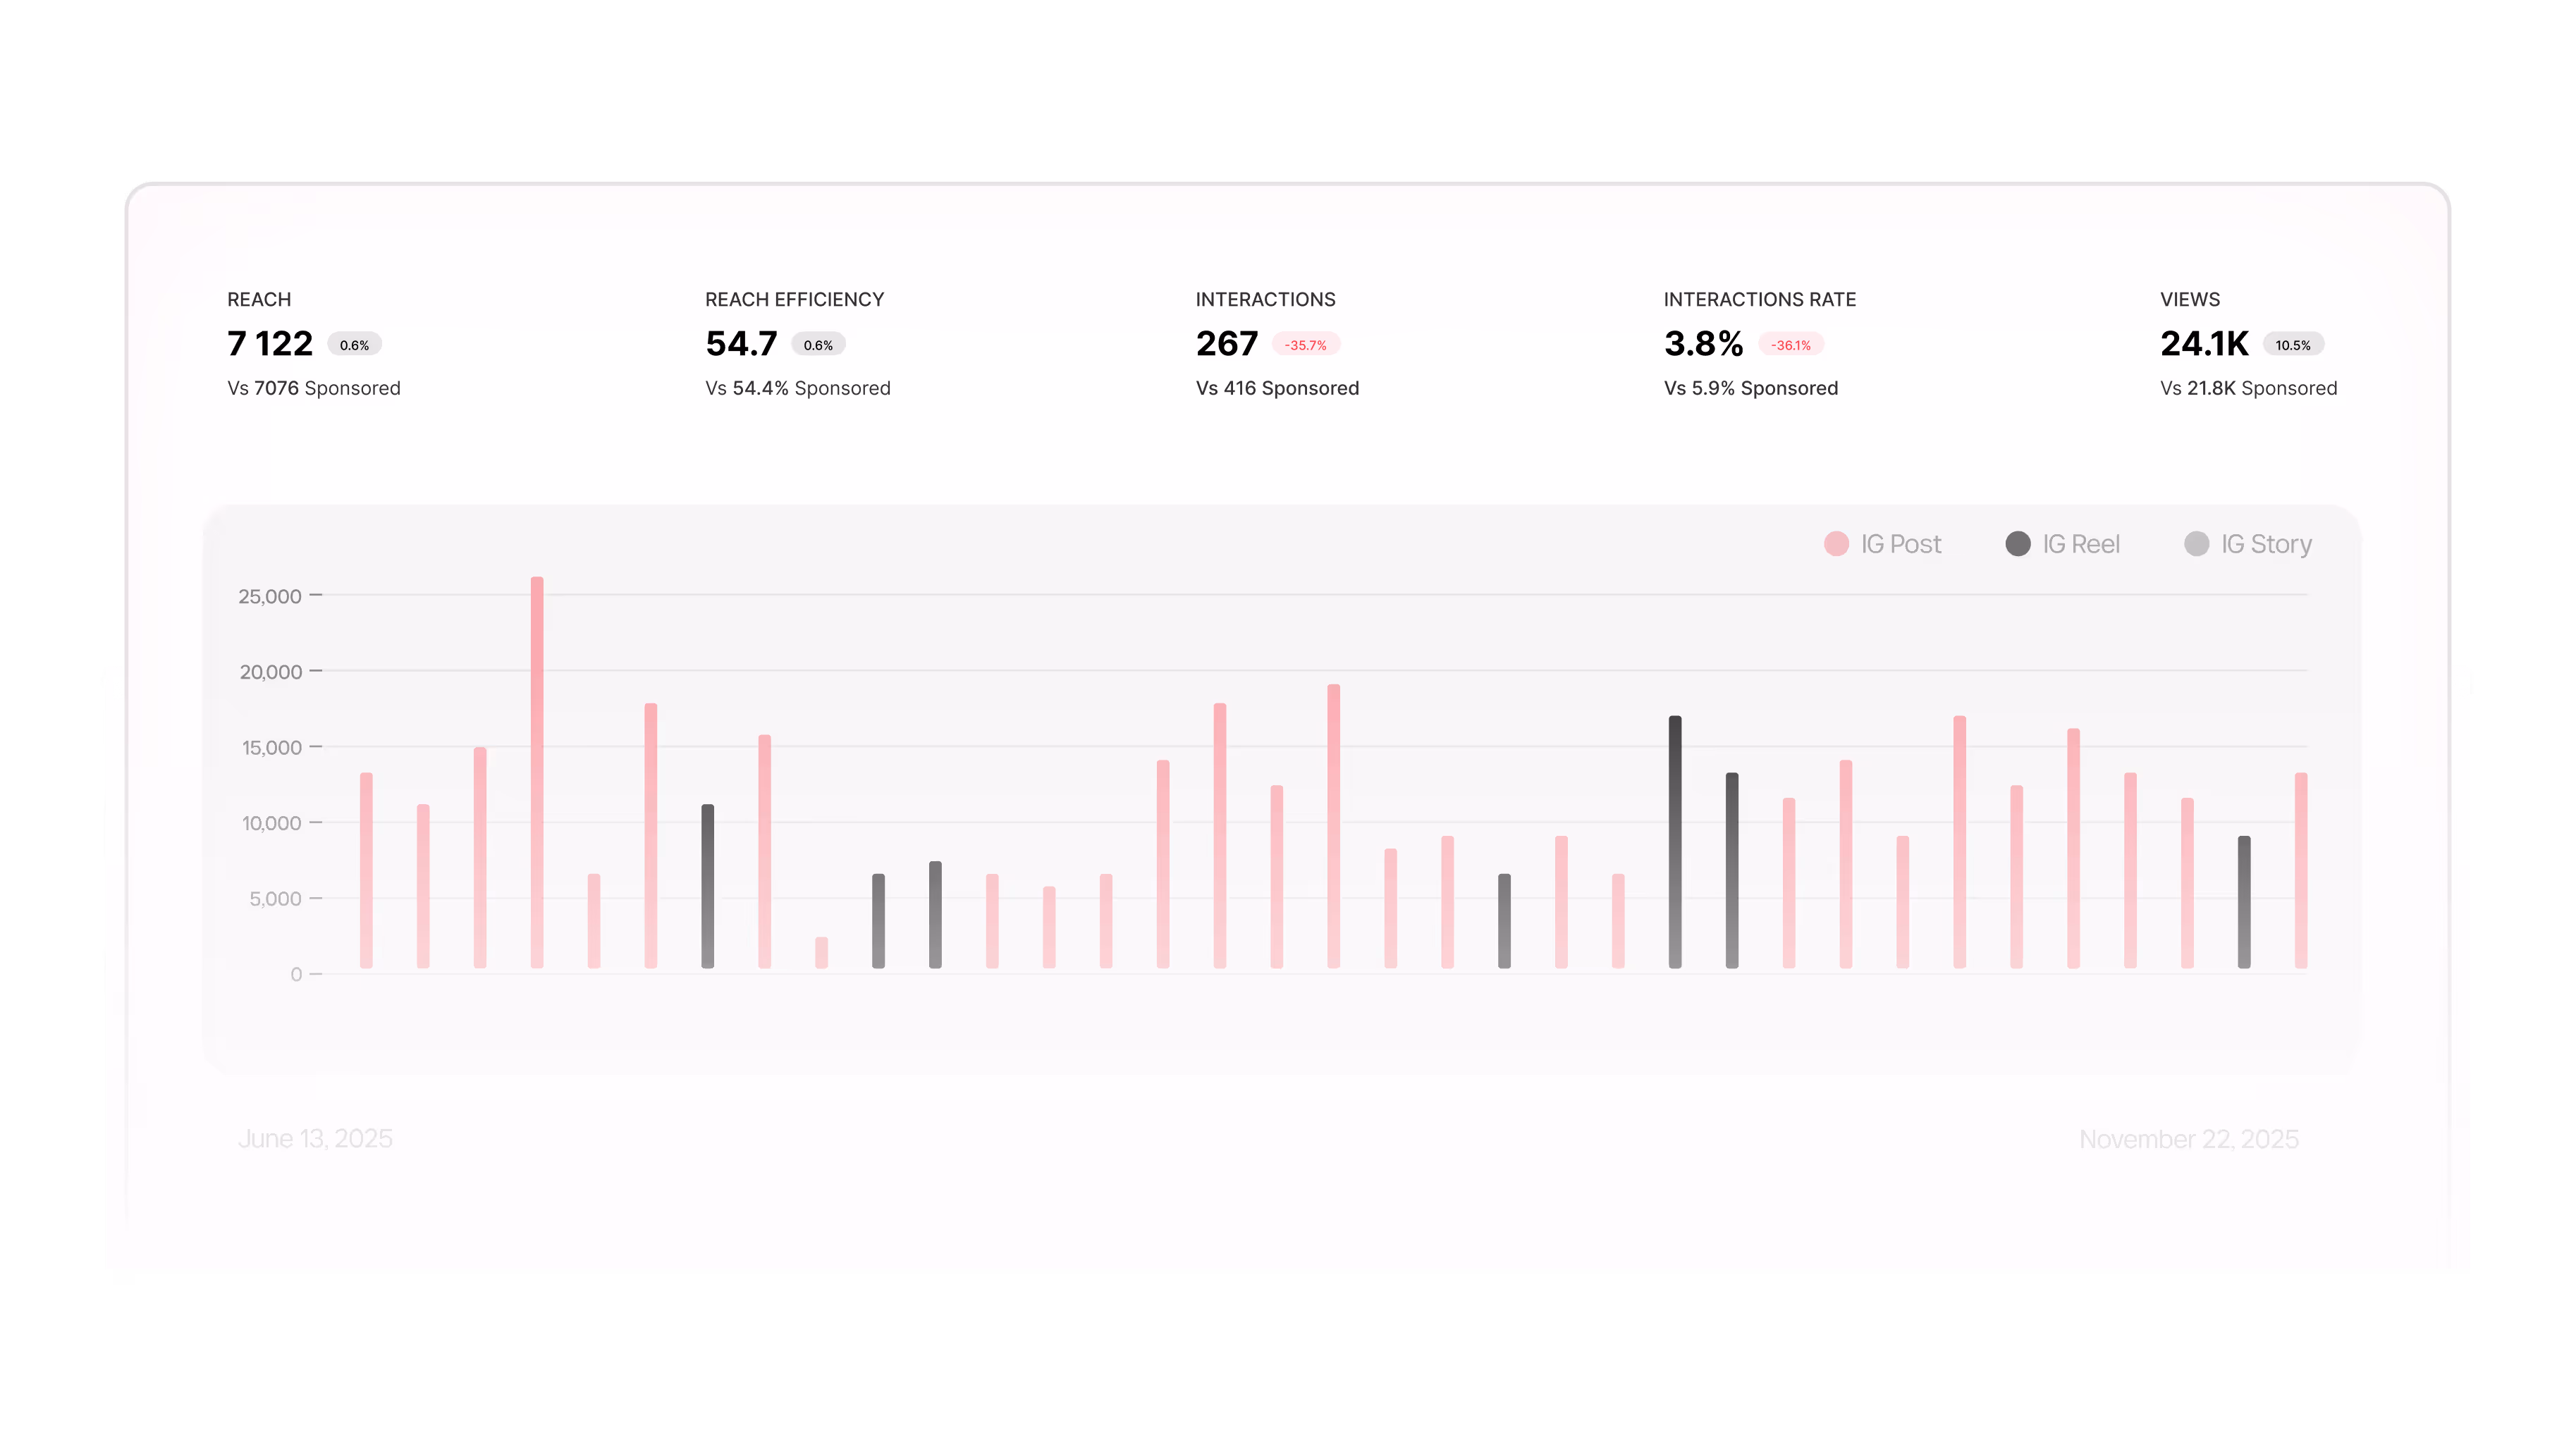
Learn what content works — and repeat it
See which posts outperform and why, so you can brief creators with real data instead of gut feel.
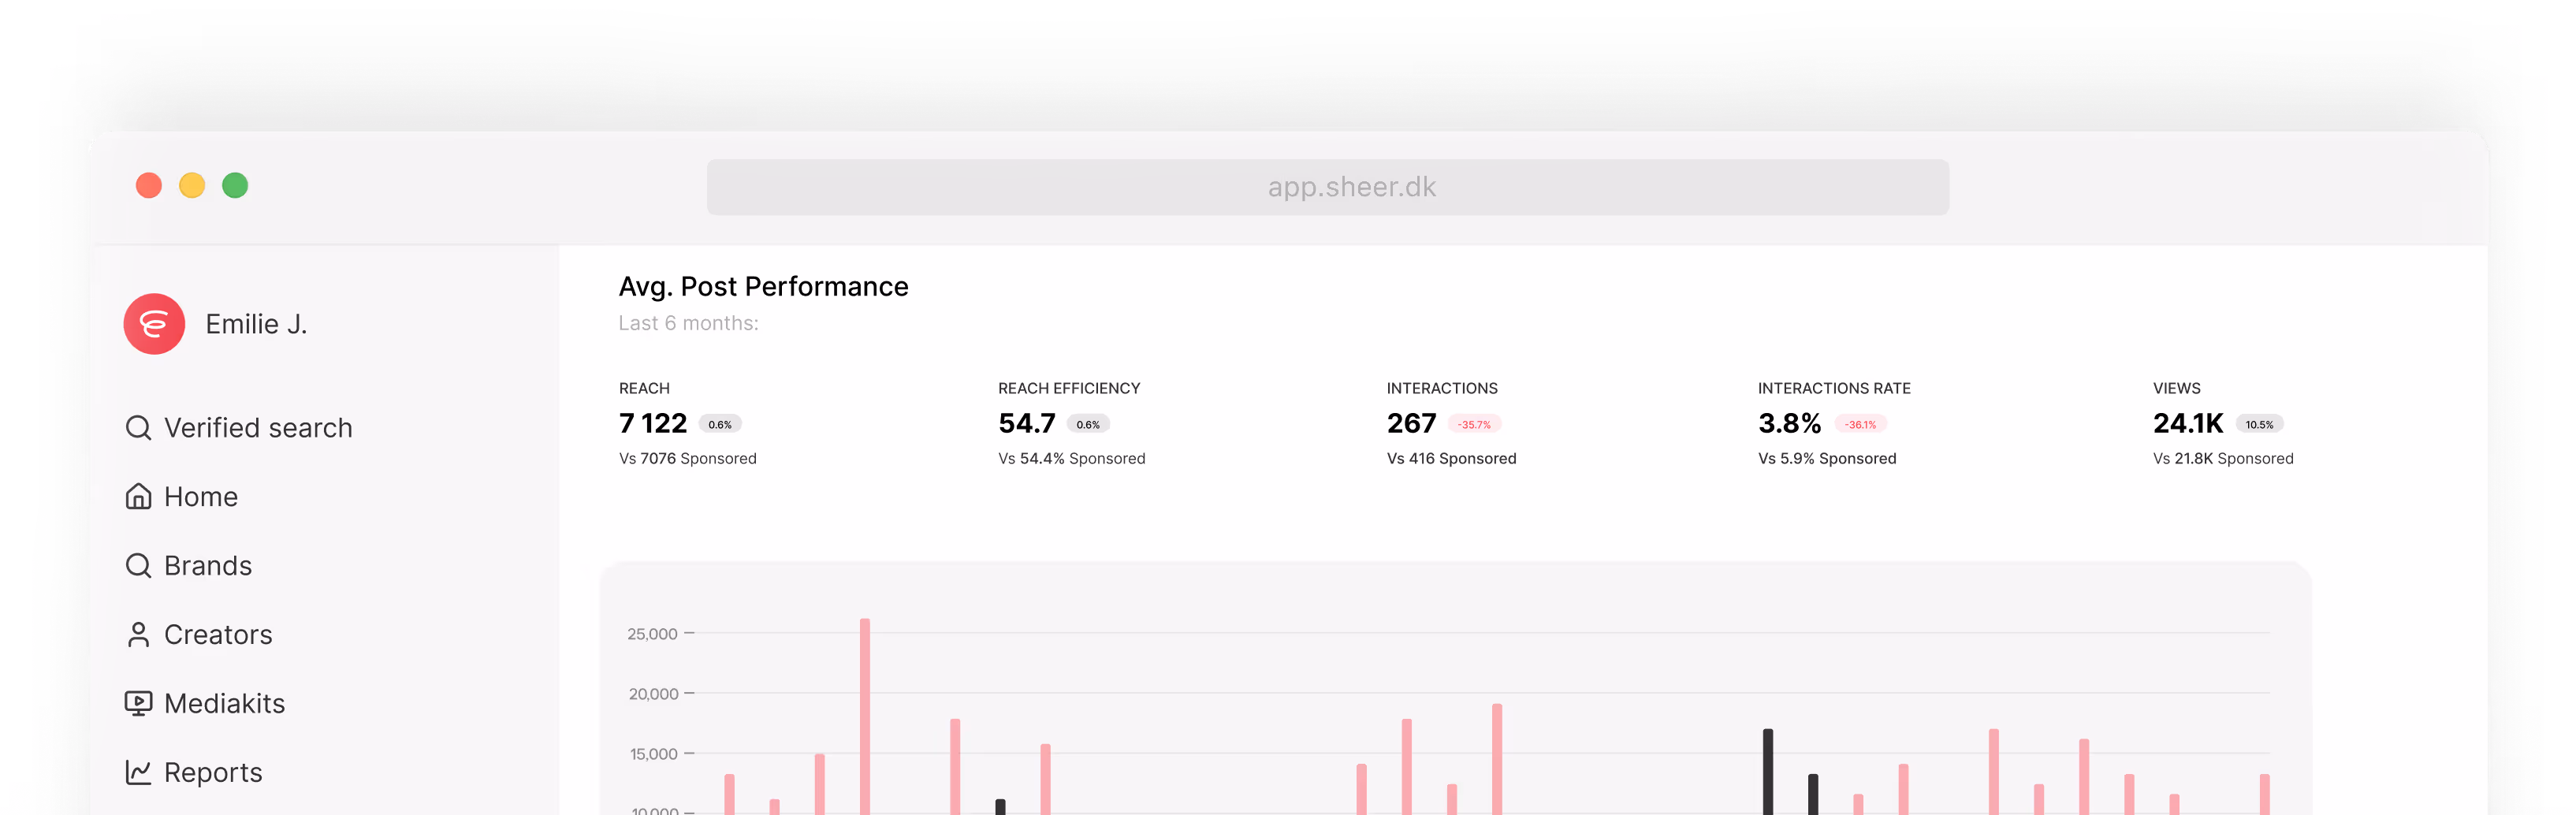
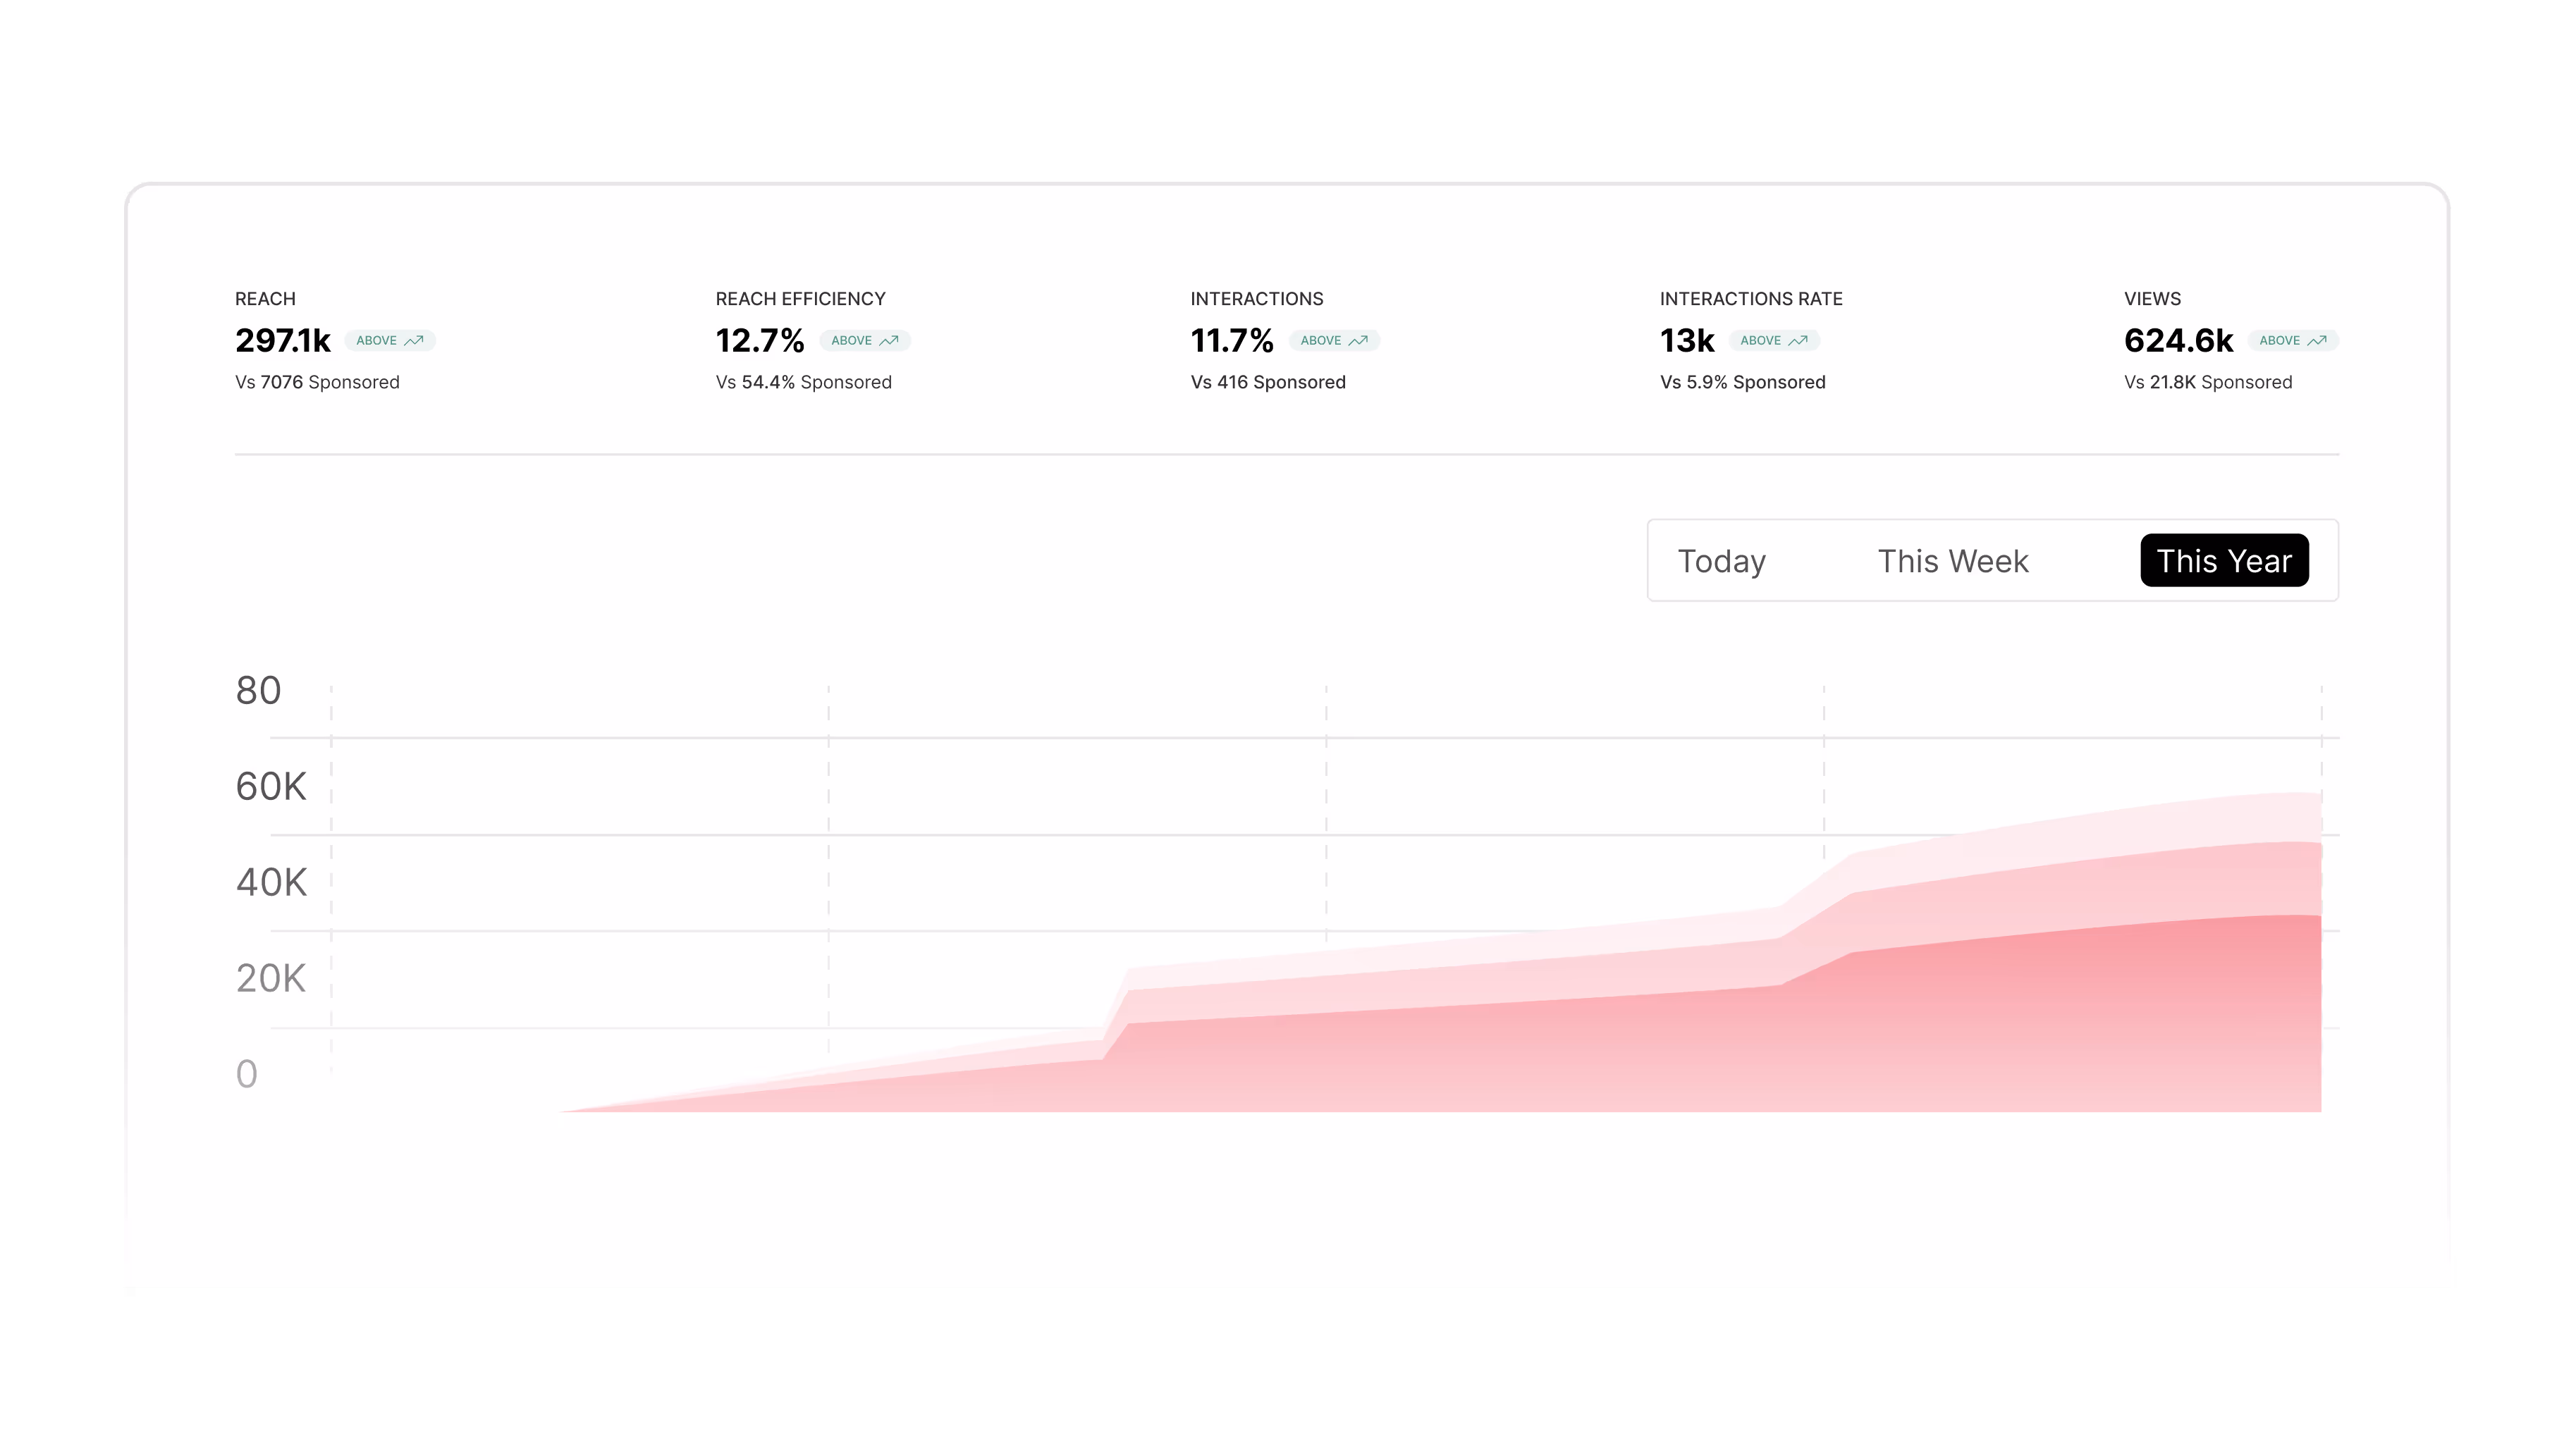
The core metrics, for creator marketing
Every metric you need to prove campaign ROI, updated in real time.
Reach. Total reach across every post in the campaign, pulled directly from first-party data. No estimates.
Reach efficiency. What percentage of a creator's audience actually sees their posts. Helps you compare creators fairly, regardless of follower count.
Interactions Likes, comments, shares, and saves — all in one view. See which creators are generating real engagement, not just impressions.
Interaction rate. Compare creators on a level playing field. Interaction rate normalizes for follower count so you can spot your best performers fast.
Views. Total video and story views across the campaign. The simplest measure of how much attention your content got.
Find, track, and report — in one place
Stop jumping between spreadsheets, DMs, and screenshot folders. Sheer brings creator discovery, campaign tracking, and reporting into one platform.
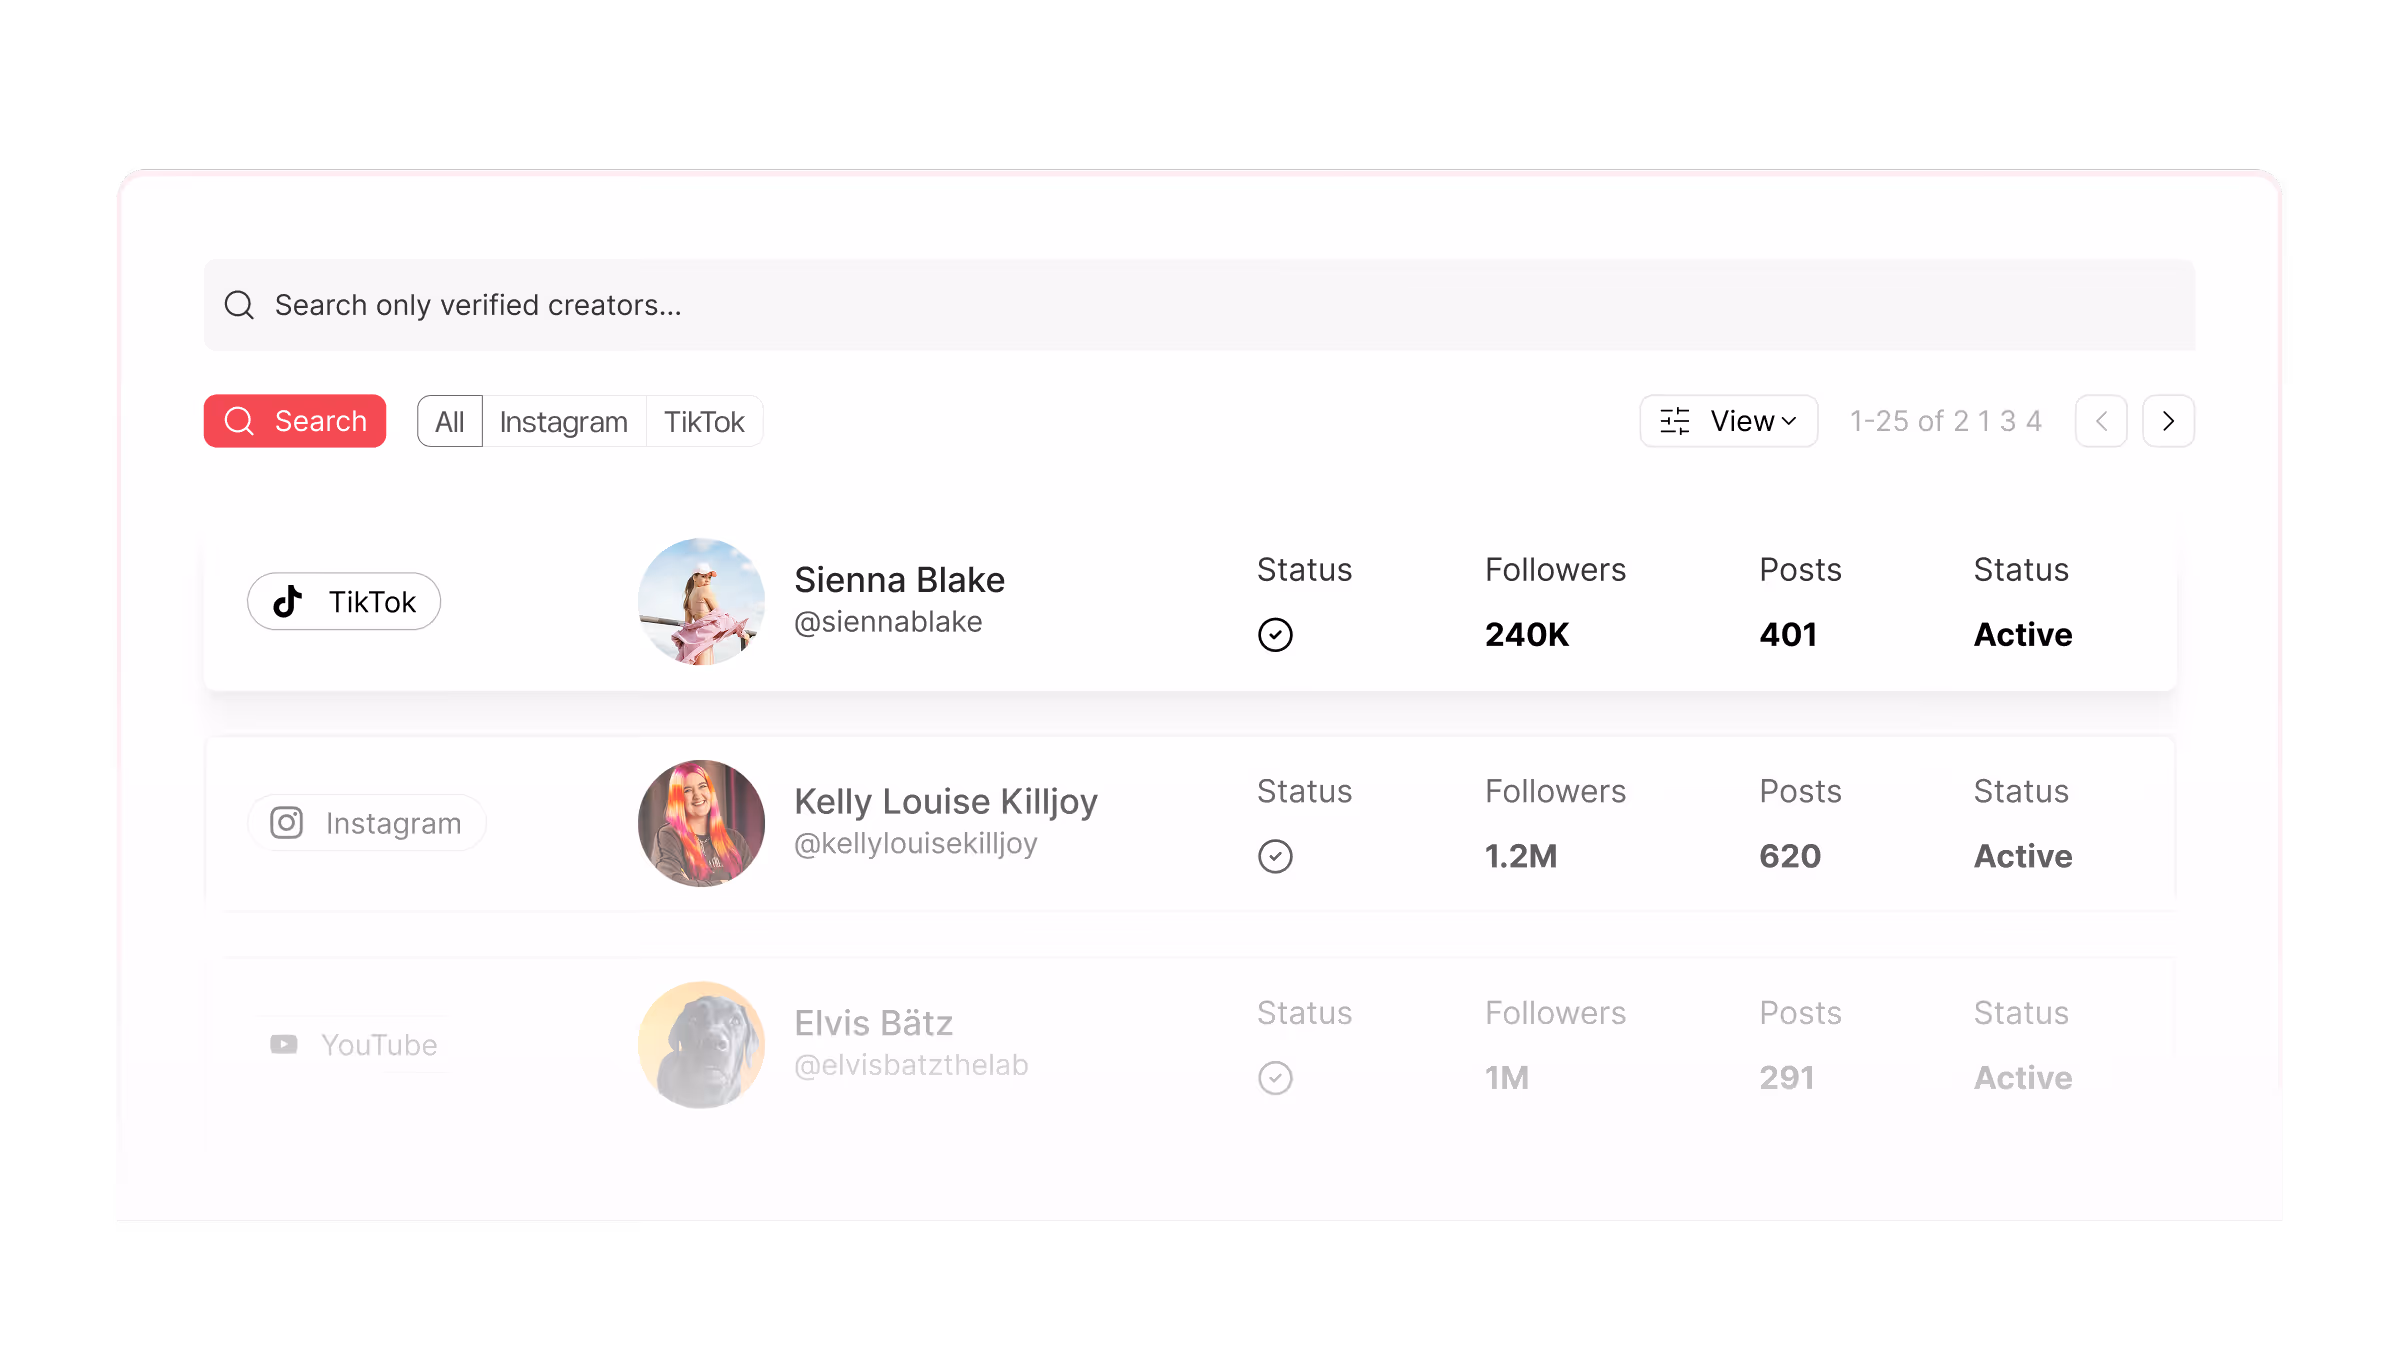
Find Winners, Not Just Followers
Stop guessing. Use first-party data to find creators who actually move the needle for your clients.
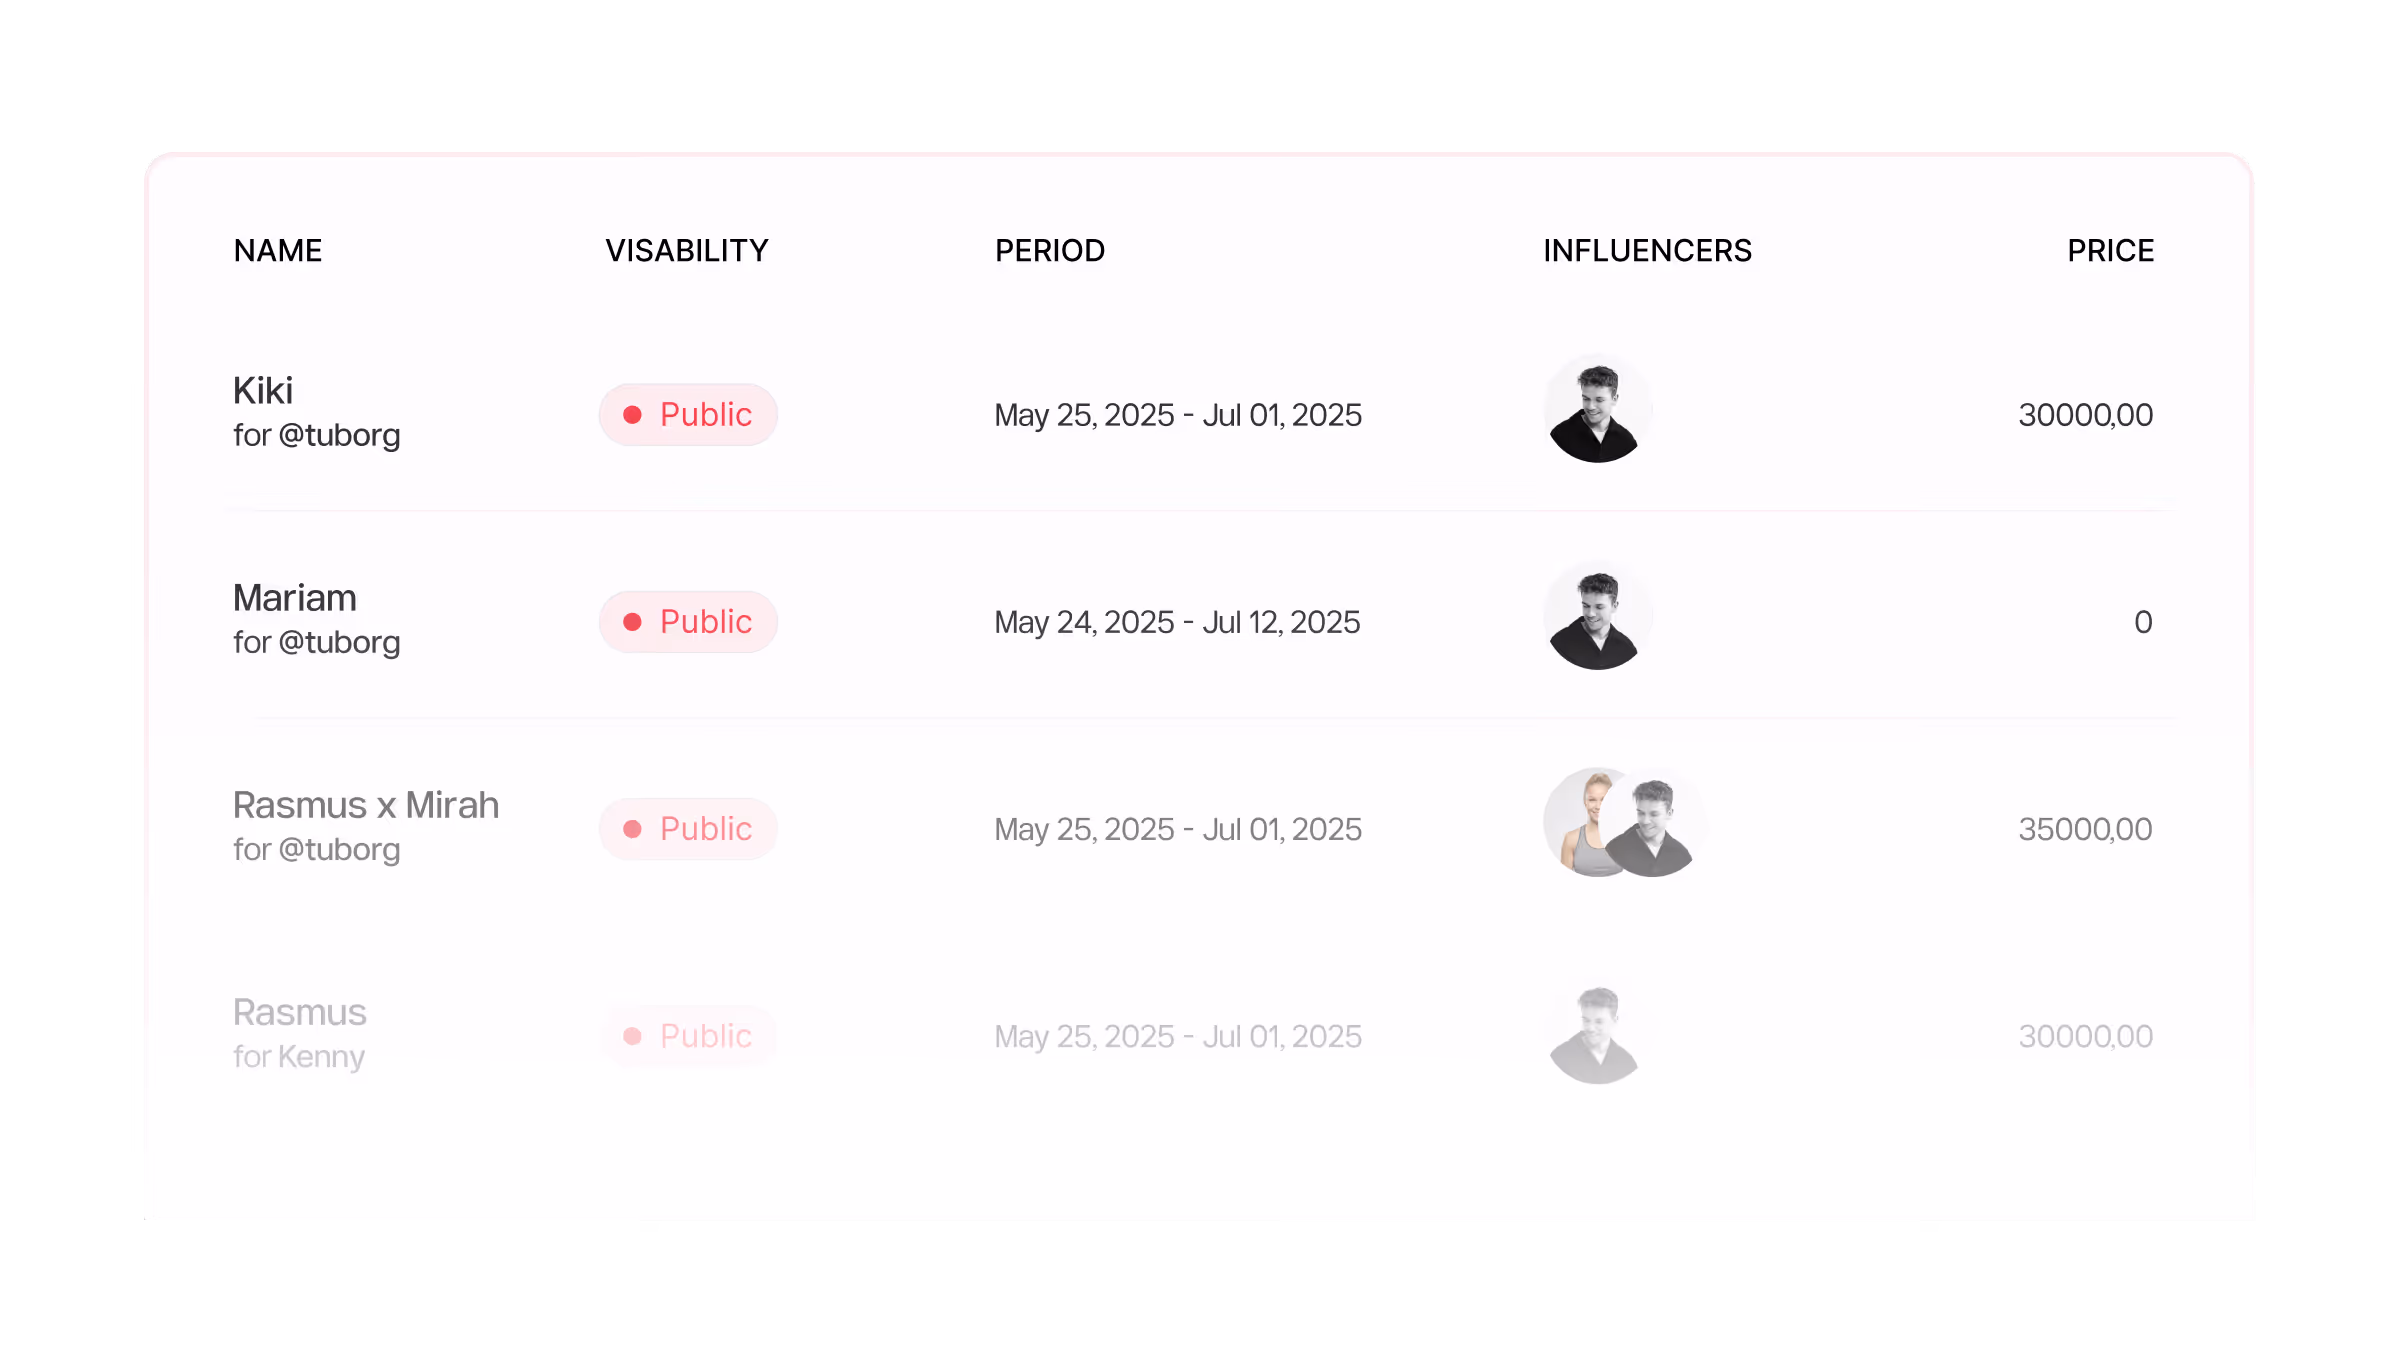
Collaborate Without the Chaos
Centralize your notes and history for every client. No more "Where is that link?" - just a clean, shared source of truth.
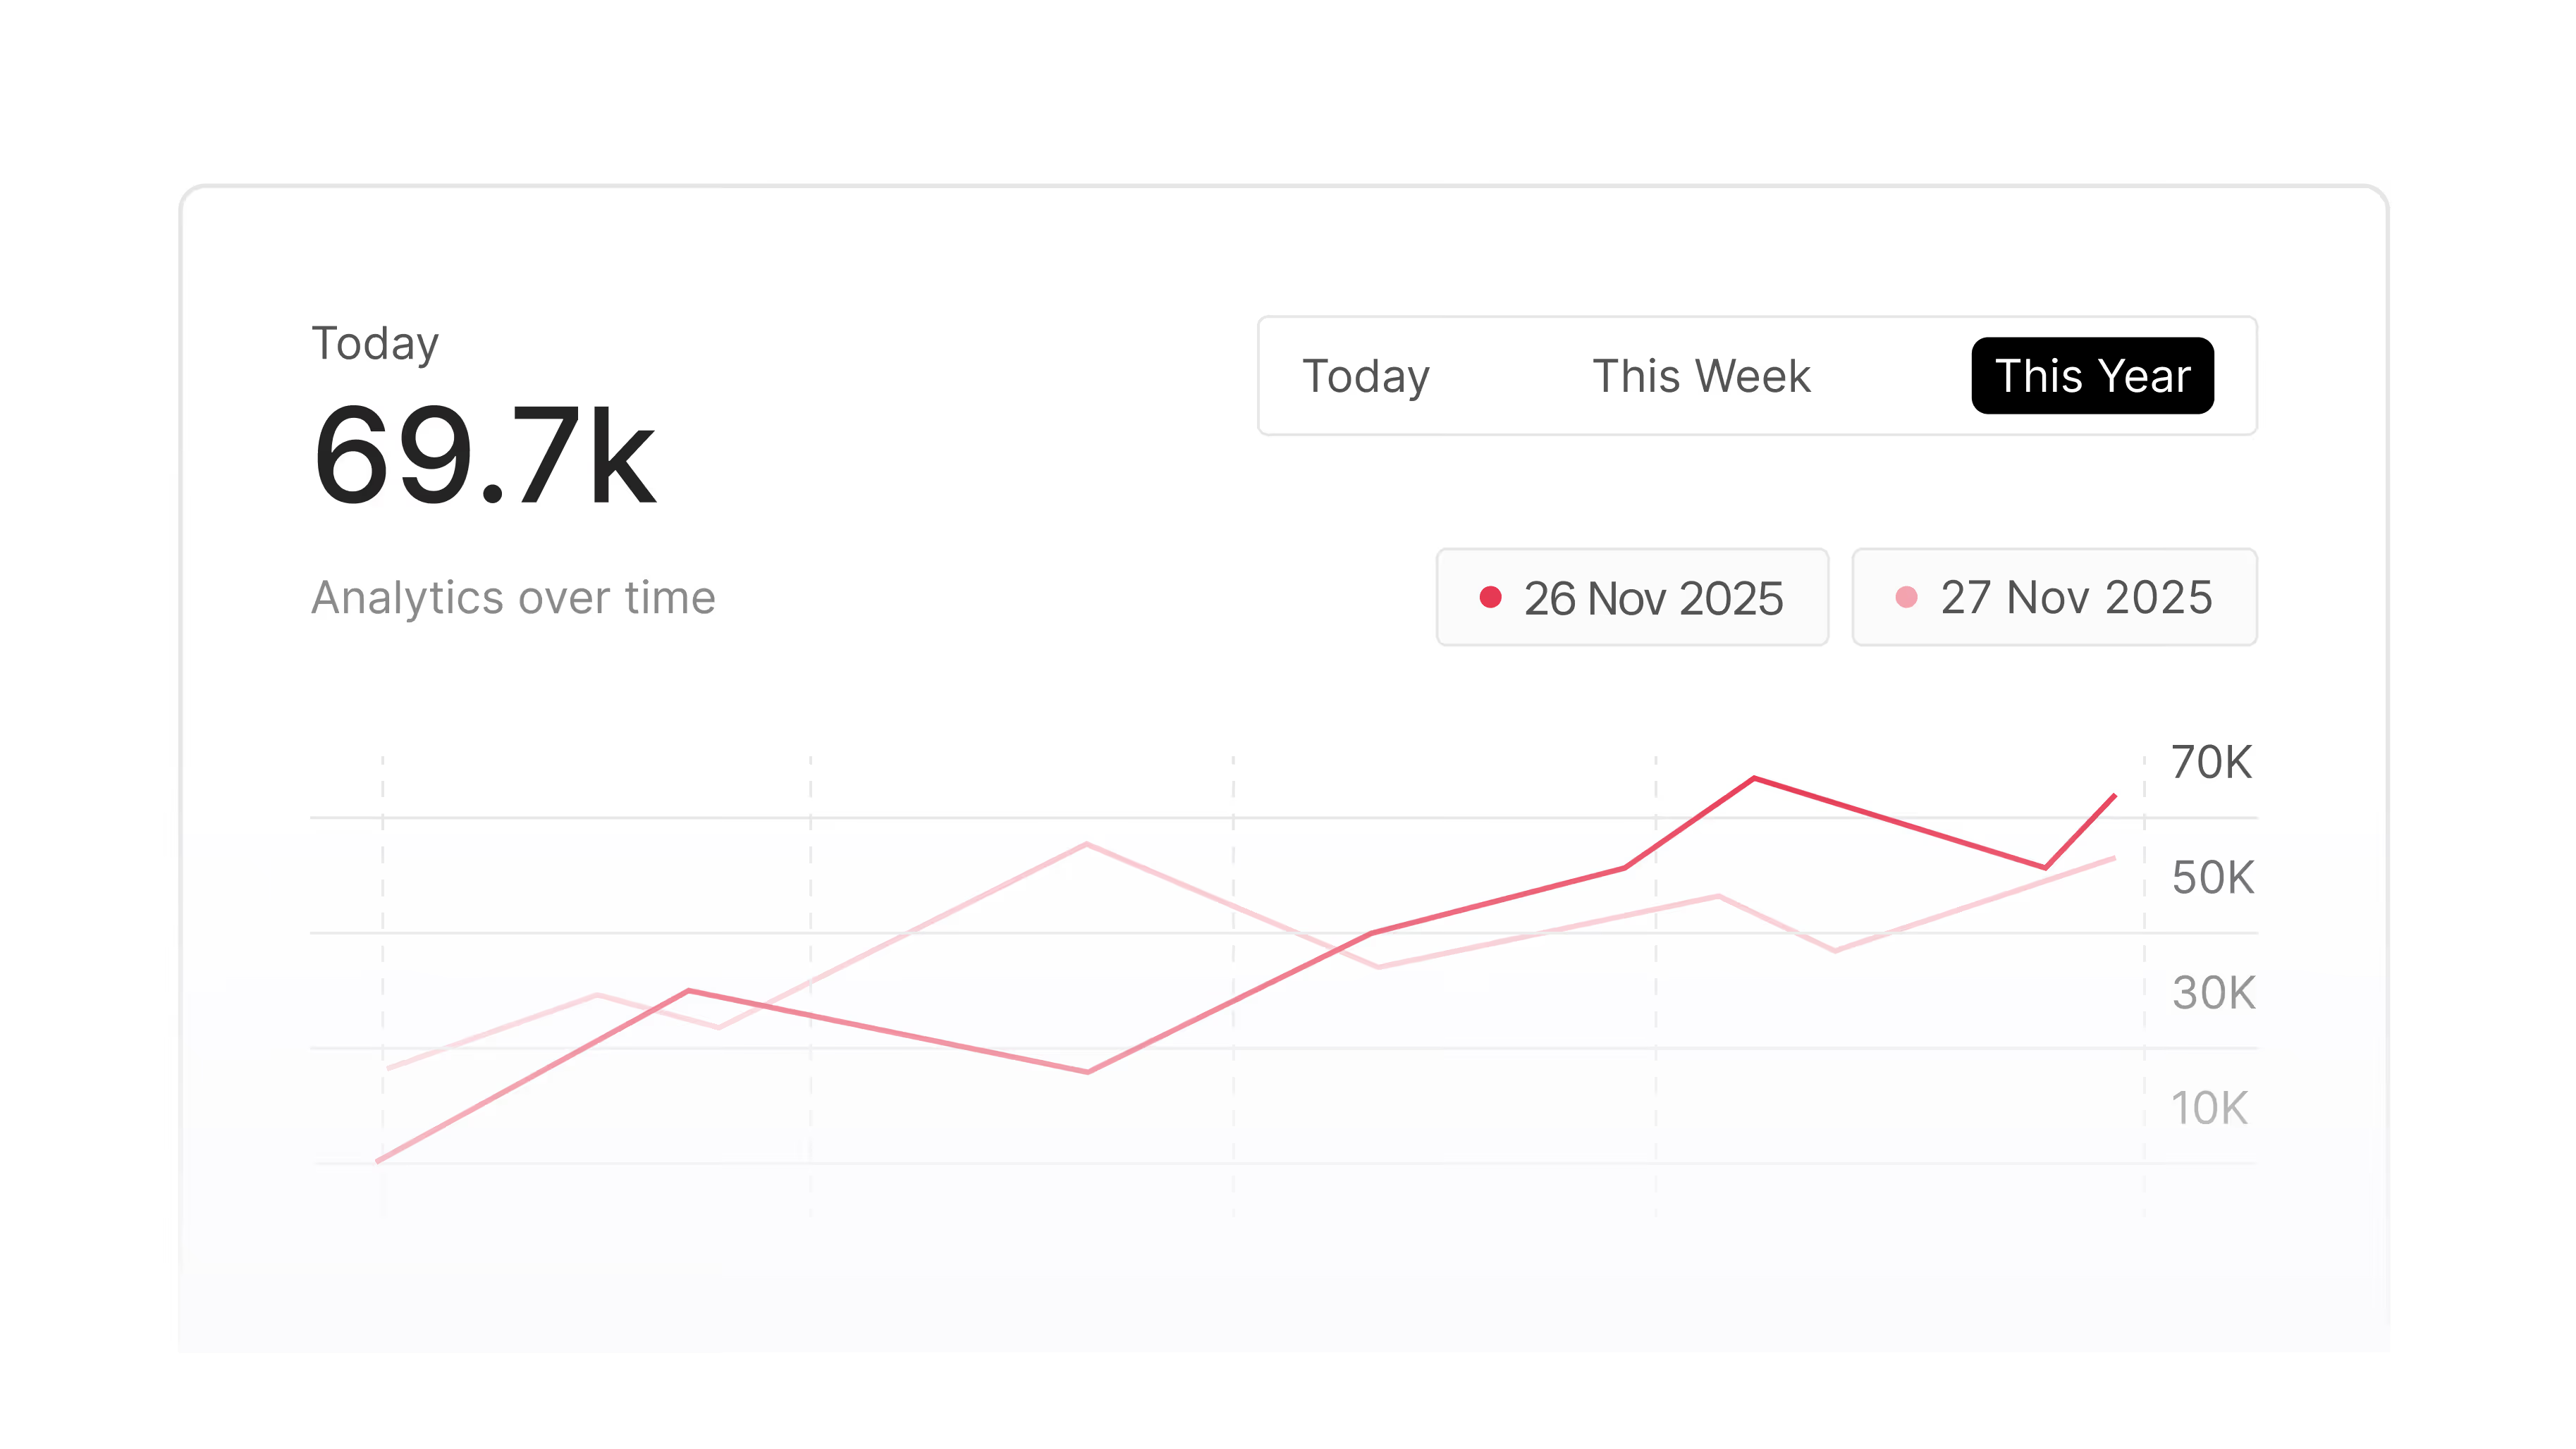
Results update as they happen
Watch your campaigns live. See what's working and what isn't the moment it happens — no manual data pulls.
Reports you can share right now
Skip the slide deck. Share a live report link with your client in two clicks.
Eliminate the "Update" Meeting
Keep your entire team and your clients on the same page. No extra tools, no endless Slack threads, just execution.
What teams are saying
Agencies, talent managers, and creators use Sheer to run campaigns with less manual work.


An indispensable tool that ensures valid data and a complete overview of our campaigns. The support is top-notch, allowing us to always document results with high credibility.


Sheer has eliminated huge amounts of manual work, effectively saving us half an employee every month. The professional overview makes it easy to document value and strengthens our dialogue with clients.


We’ve relied on Sheer since day one for trustworthy data and a beautiful interface. It covers all our needs and evolves constantly with the industry – we simply couldn’t do without it.
An indispensable tool that ensures valid data and a complete overview of our campaigns. The support is top-notch, allowing us to always document results with high credibility.

Sheer has eliminated huge amounts of manual work, effectively saving us half an employee every month. The professional overview makes it easy to document value and strengthens our dialogue with clients.
We’ve relied on Sheer since day one for trustworthy data and a beautiful interface. It covers all our needs and evolves constantly with the industry – we simply couldn’t do without it.
Frequently Asked Questions
We didn’t answer your question? Feel free to reach out, our team will be happy to help.
They are live campaign reports that update as posts are added and performance data comes in. You can check results to date at any time, without rebuilding a deck.
You can track core metrics like reach, views, interactions, and interaction rate. You can also add deeper signals like impressions, saves, shares, profile actions, link clicks, sticker taps, and watch time.
Yes. You can select the data points you want to see, so the report matches the KPI you care about.
It’s a way to read reach in context of the creator’s size. It helps you compare creators with different follower counts.
The report follows the campaign timeline and shows results to date. As the campaign continues, the report keeps updating.